course
Displaying Data in Charts
WorkForge
Updated Jul 19, 2026
What you'll learn
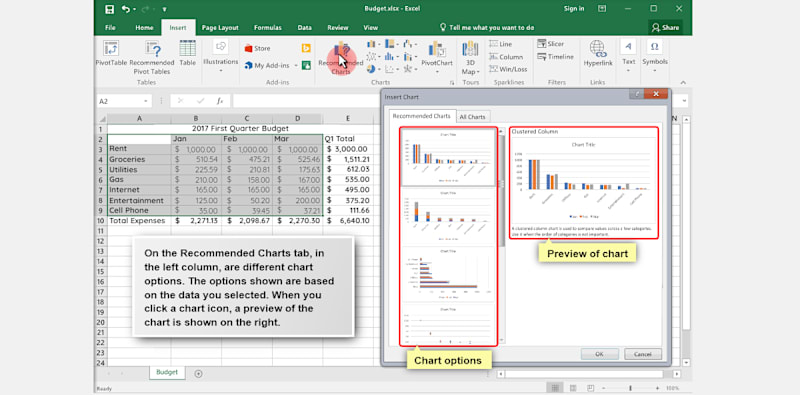
- Create a chart based on Excel data
- Define common chart elements
- Describe how to change the chart layout, colors, style, or other options
- Explain how to reposition or resize a chart
- Create and edit Sparklines
Course Description
There is an old saying that a picture is worth a thousand words. Excel's chart tools enable you to present complex data in an easy to understand visual format.